The Hadley circulation (HC) is an important component of the three annual mean meridional cells and its variations can significantly affect global climate. Professor Zhemin Tan's group from the School of Atmospheric Sciences has made important progress in Hadley circulation study with a serial of papers published on the impacts of El Niño-Southern Oscillation (ENSO) on HC.
In their first paper, titled Relationship between El Niño–Southern Oscillation and the symmetry of the Hadley circulation: Role of the sea surface temperature annual cycle, which was published earlier in AMS's Journal of Climate, researchers revealed that the tropical sea surface temperature (SST) annual cycle has an important modulation effect on the relationship between ENSO and the asymmetric mode (AM) of HC.
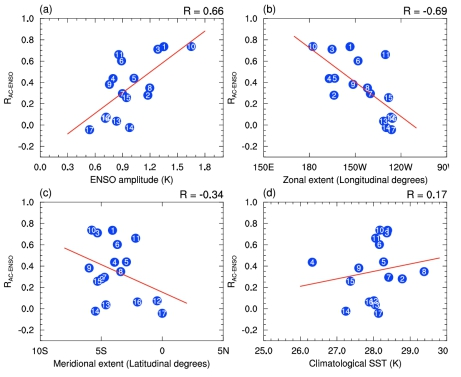
Based on that, researchers investigated the sensitivity of the HC-ENSO relationship with various ENSO properties using the historical outputs from 17 CMIP5 models and found that the HC-ENSO relationship is most closely correlated with the zonal extent, which means a more westward extension of ENSO SSTA can lead to a closer HC-ENSO relationship (Fig.1). This finding indicates the importance of the ENSO zonal extent in climate models to accurately simulate ENSO pattern and promotes our understanding about to what degree ENSO events may impact the HC in a warming world. The results are published in AGU's Geophysical Research Letters.
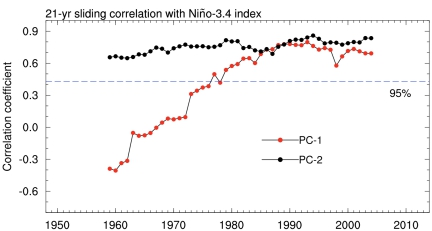
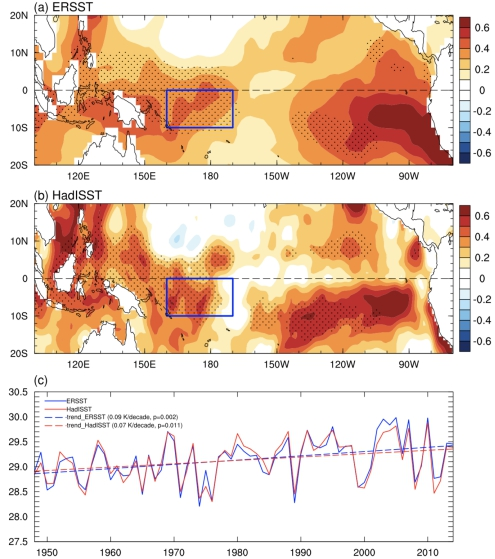
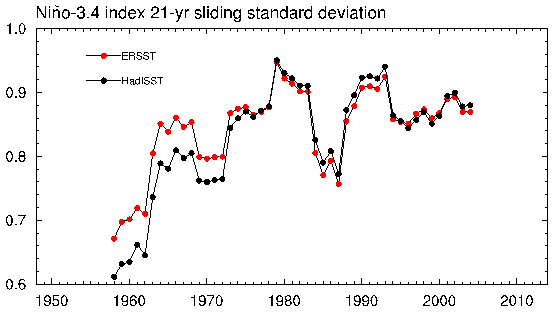
The third paper was about the interdecadal strengthening of ENSO-HC relationship, which is referred to as the HC regime change (Fig.2). Previous studies suggested that HC regime change is a possible response to the equatorially asymmetric sea surface temperature (SST) warming over the eastern Pacific. In the new study, however, the authors further pointed out that the recent HC regime change may result from a combined effect of the western Pacific warming and increased ENSO amplitude in the last several decades (Figures 3–4), which could provide a new understanding for interdecadal changes in the ENSO-related climate anomalies in the 1970s.
All the above works were accomplished in the MOE Key Laboratory of Mesoscale Severe Weather (LMSWE), NJU and were jointly supported by the National Key Research and Development Program of China, the National Natural Science Foundation of China, the National Key Project for Basic Research (973 Project) and many other projects. Doctor Yipeng Guo is the first author, and Professor Zhemin Tan is the corresponding author.
Links to the papers and references:
Guo Y. P., and Z. M. Tan, 2018: Relationship between El Niño-Southern Oscillation and the symmetry of the Hadley circulation: Role of the sea surface temperature annual cycle, J. Climate., 31, 5319-5331. doi: 10.1175/JCLI-D-17-0788.1.
Guo Y. P., and Z. M. Tan, 2018: On the sensitivity of the relationship between Hadley circulation asymmetry and ENSO in CMIP5 models, Geophysical Research Letters, 45, 9253-9259. https://doi.org/10.1029/2018GL079515.
Guo Y. P., and Z. M. Tan, 2018: The Hadley circulation regime change: Combined effect of the western Pacific warming and increased ENSO amplitude, J. Climate. 31, 9739-9751. DOI: 10.1175/JCLI-D-18-0306.1

Fig.1. Changes in the R AC-ENSO against the changes in (a) ENSO amplitude (units: K), (b) ENSO zonal extent (units: deg), (c) ENSO meridional extent (units: deg), and (d) climatological mean SST (unit: K) during FMA for the 17 CMIP5 models, which are denoted by sequence numbers in the blue dots.

FIG. 2. The 21-yr sliding correlations of the Niño-3.4 index with PC-1 (red dotted line) and PC-2 (black dotted line). The blue dashed line indicates the 95% confidence level.

FIG. 3. DJF mean SST difference between 1979–2014 and 1948–76 based on the (a) ERSST and (b) HadISST datasets. The stippled areas indicate values exceeding the 95% confidence level. (c) Time series of the mean SST averaged over the blue box (108S–08, 1608E–1708W) based on the ERSST (blue line) and HadISST (red line) datasets. The blue and red dashed lines denote the trend lines based on ERSST and HadISST datasets, respectively.

FIG. 4. The 21-yr sliding standard deviations of the Niño-3.4 index for ERSST (red dotted line) and HadISST (black dotted line) datasets during 1948–2014.
